Map Portfolio - Michael F. Nelson
This page showcases the maps that I created in the course GEOG 414: Programming for Geospatial Data Science II.
I started this course with no knoweldge of JavaScript or webmapping. Over the course of the semester, I learned intermediate JavaScript syntax including flow control, writing functions, data structures, interacting with the Document Object Model (DOM), and more. I also greatly increased my knoweldge of html programming and learned about using bootstrap to construct appealing and functional webpages.
Through the lectures, technical demonstrations, and assignments I also learned the basics of creating interactive webmaps using a variety of platforms and paradigms. Some specific webmapping skills I learned include:
- Creating slippy maps, custom legends, and tooltip popups with Leaflet. (Maps 1-2, 4-5)
- Using GeoJSON to display interactive map features. (Maps 1-2, 4-5)
- Using D3, C3, and SVG to make interactive maps and charts. (Map 4)
- Using GeoServer to host a WMS to serve custom-formatted vector and raster tiles. (Map 3)
- Creating a server using Amazon Web Services to host a website with a custom domain name (this site!).
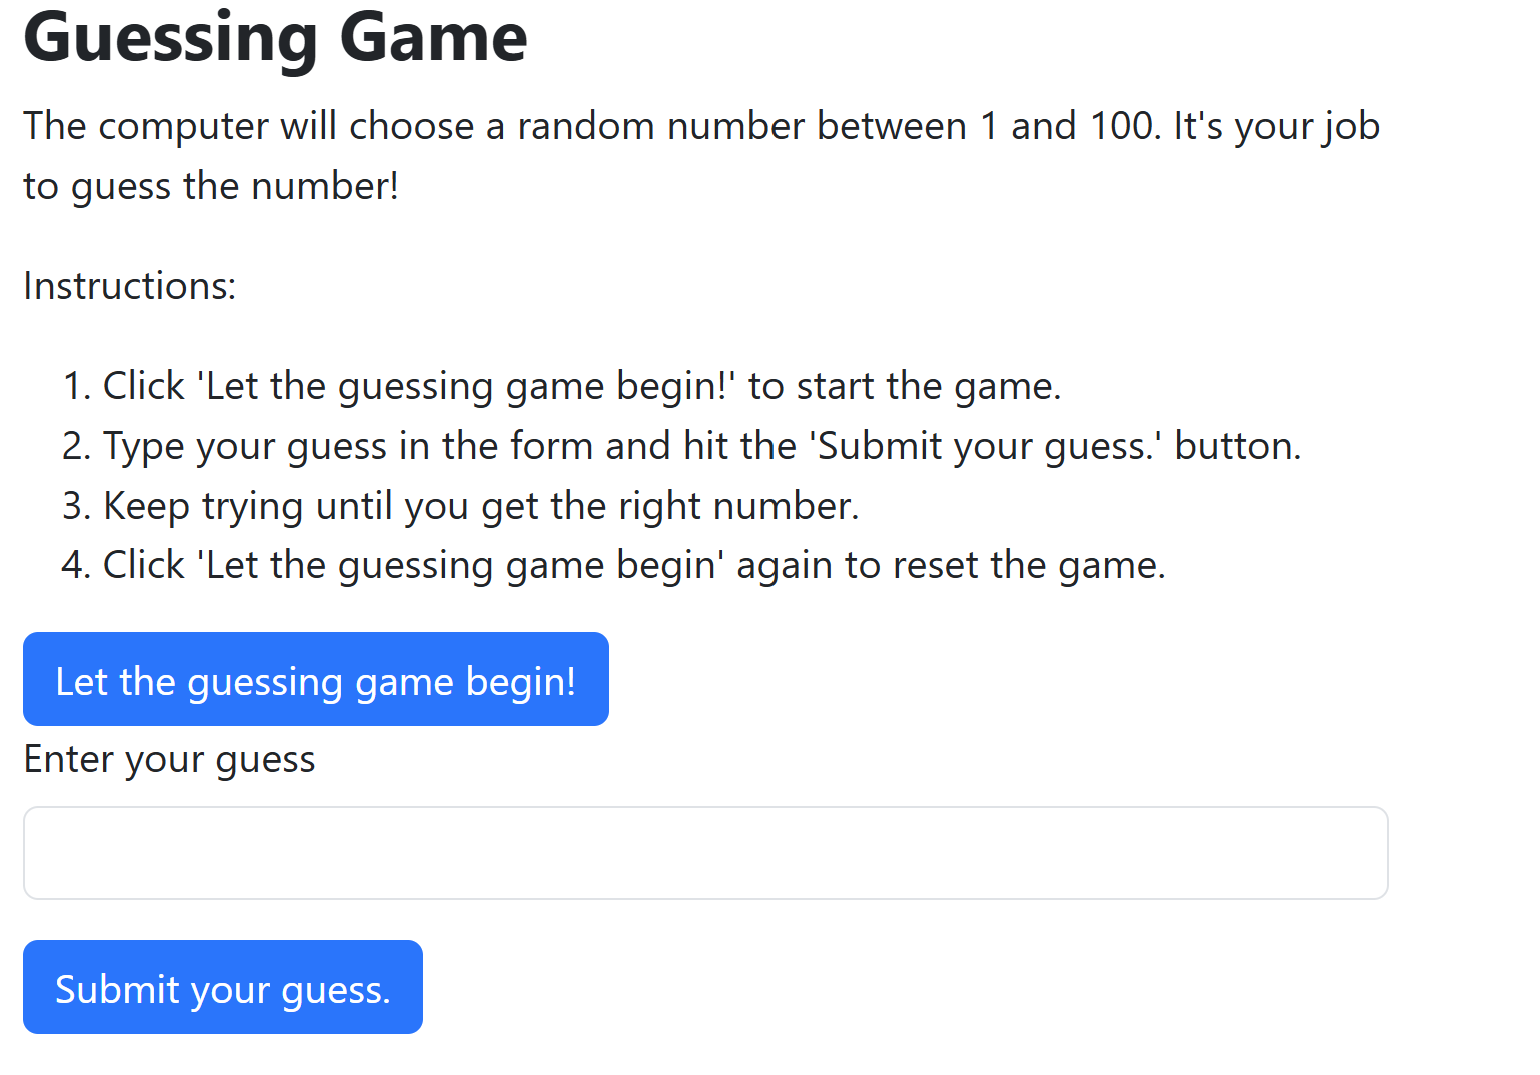
In this exercise, we learned basic JavaScript syntax through a series of mini-exercises, each designed to accomplish a specific tast. In addition, we implemented two more significant tasks: creating a distance calculator for two points on the surface of the earth, and a guessing game.
In addition to the JavaScript exercises, this unit was our first exposure to coding with html, and specifically using Bootstrap to quickly create a visually-appealing webpage.
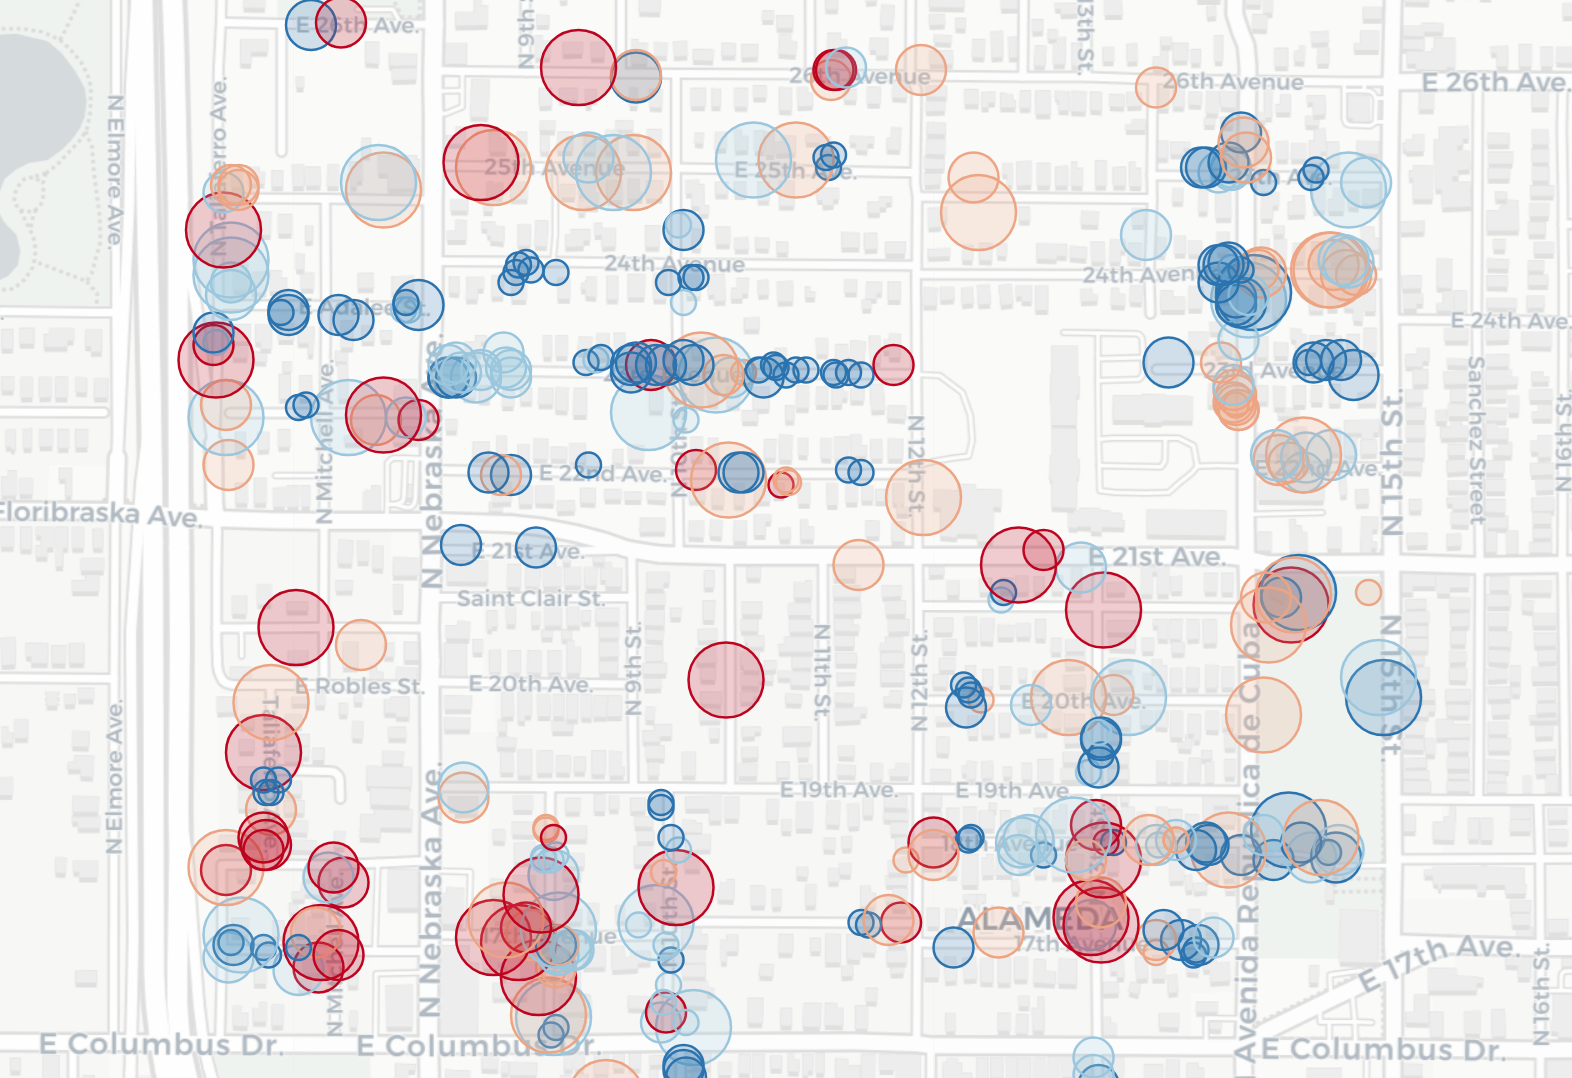
This slippy map shows an interactive version of part of the dataset from Nelson et al. 2022. Specifically, it shows selected characteristics of individual trees surveyed after Hurricane Irma in the Ybor neighborhood in Tampa Florida.
Symbols for the point features are styled by size (tree crown diameter) and color (pre-hurricane risk rating). The tooltip popup provides additional information about the trees.
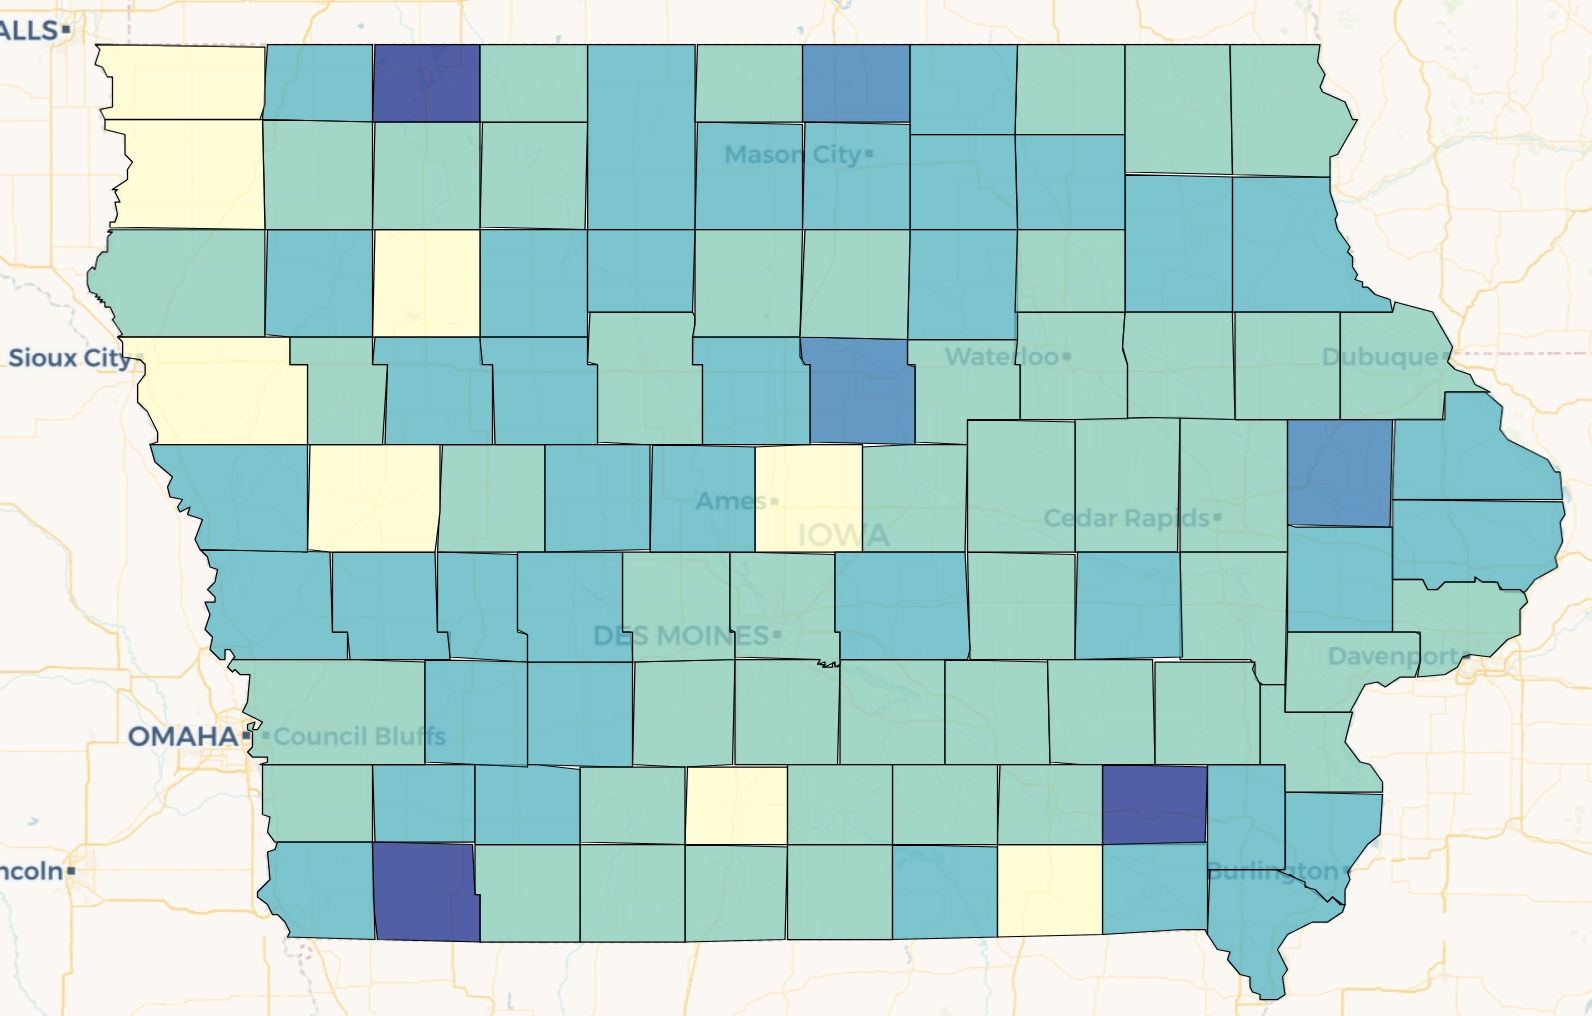
This interactive choropleth map allows the user to visualize three demographic variables (percent white, percent male, percent over 21) at the county level in the state of Iowa. The user can select which variable is shown, as well as select from a set of color ramps (from colorbrewer).
The demographic data come from the US Census Bureau American Community Survey. The county polygon data are from the US Census TIGER Line Files datasets.
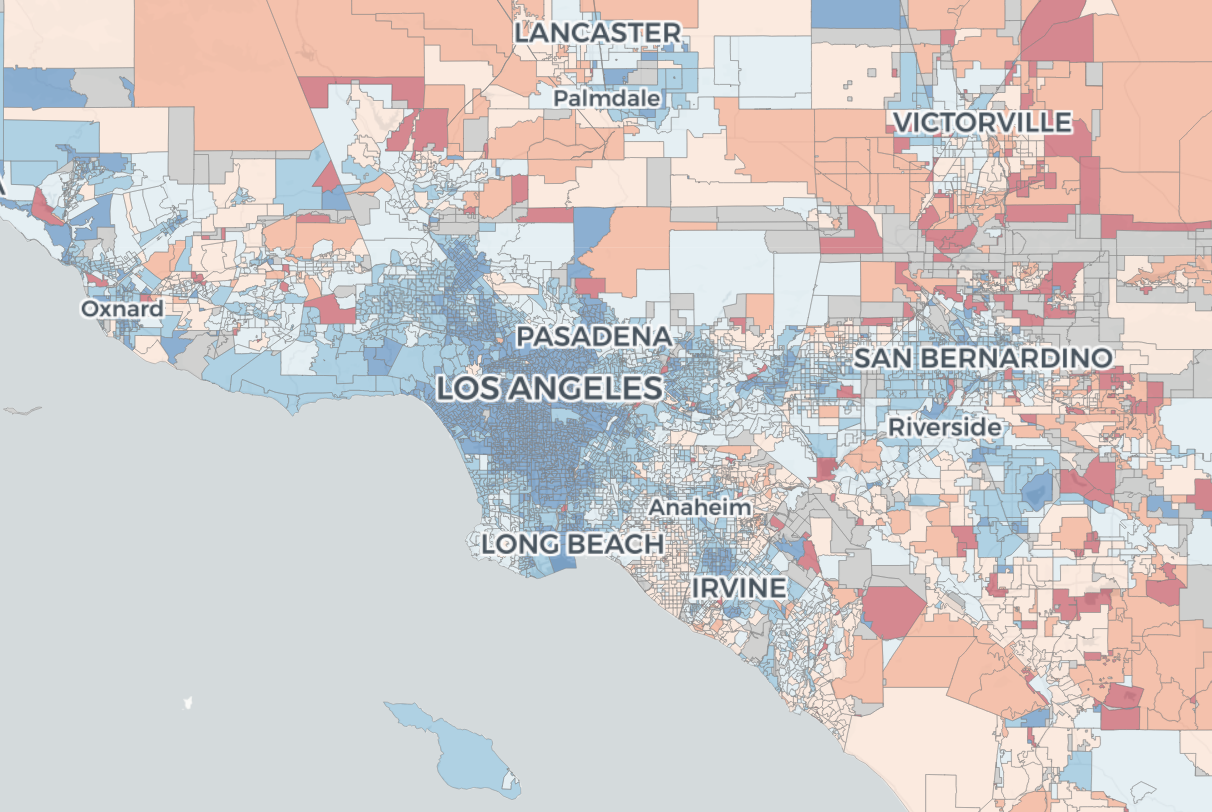
This map is a version of An Extremely Detailed Map of the 2020 Election created by the New York Times.
The background map was created using Leaflet, while the election coloring data is served using an instance of GeoServer. running on
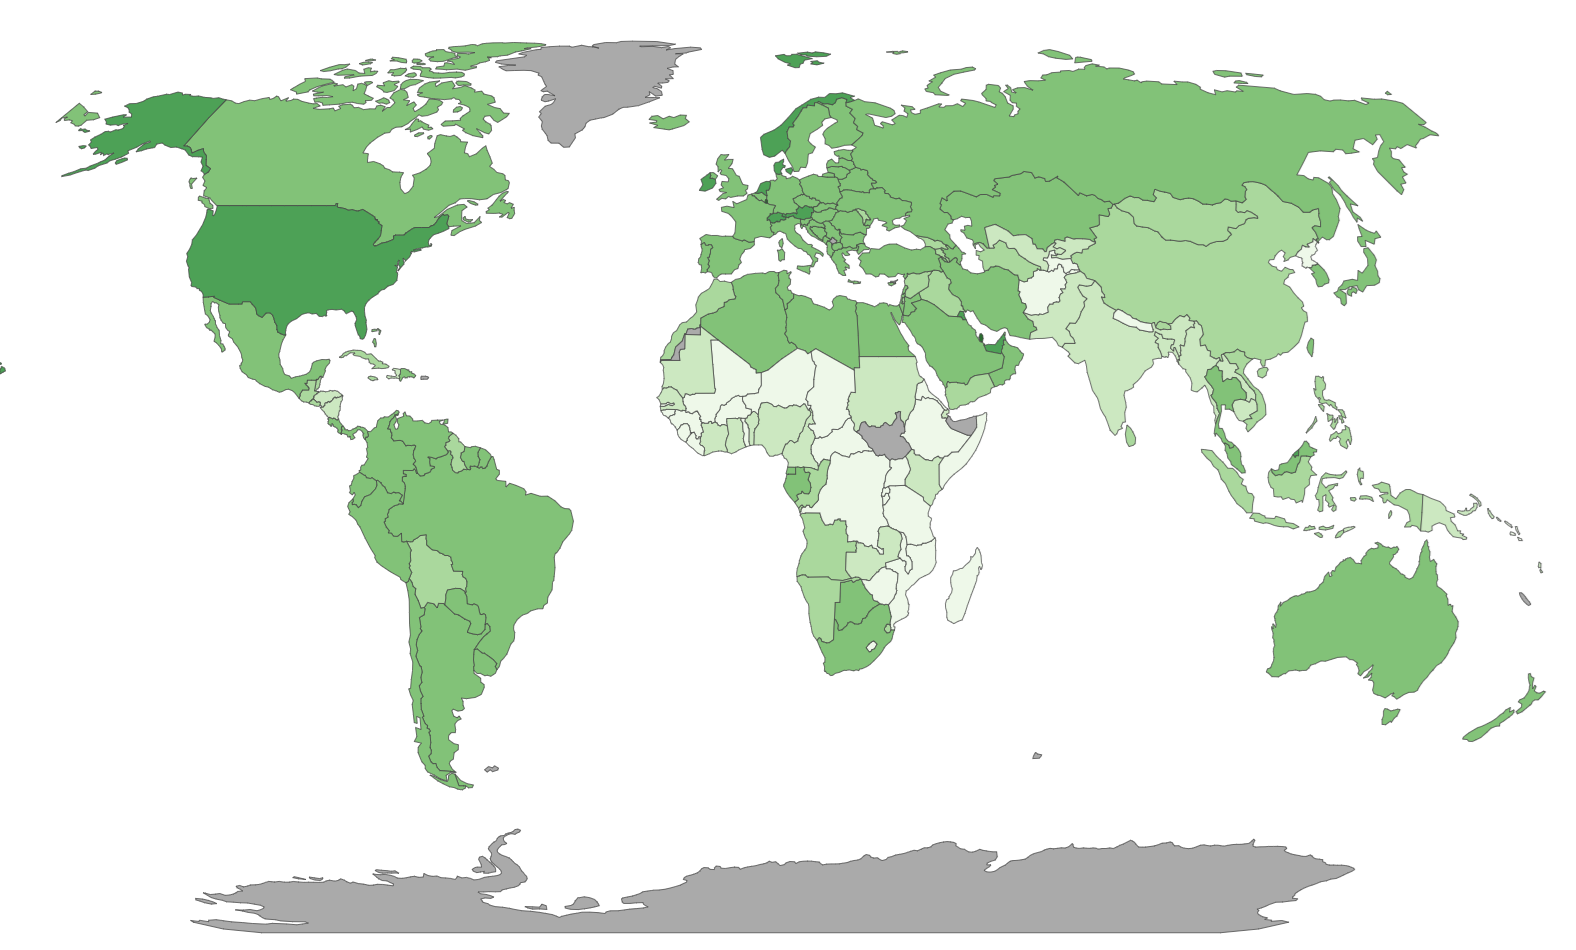
This map allows the user to choose between visualizing per capita income or income inequality (via the Gini coefficient) on a world map. The user can view yearly data from 1880 to 2010. The map is rendered using SVG and the JavaScript library D3. The time series plot and scatterplot were created using templates from the JavaScript C3 library.
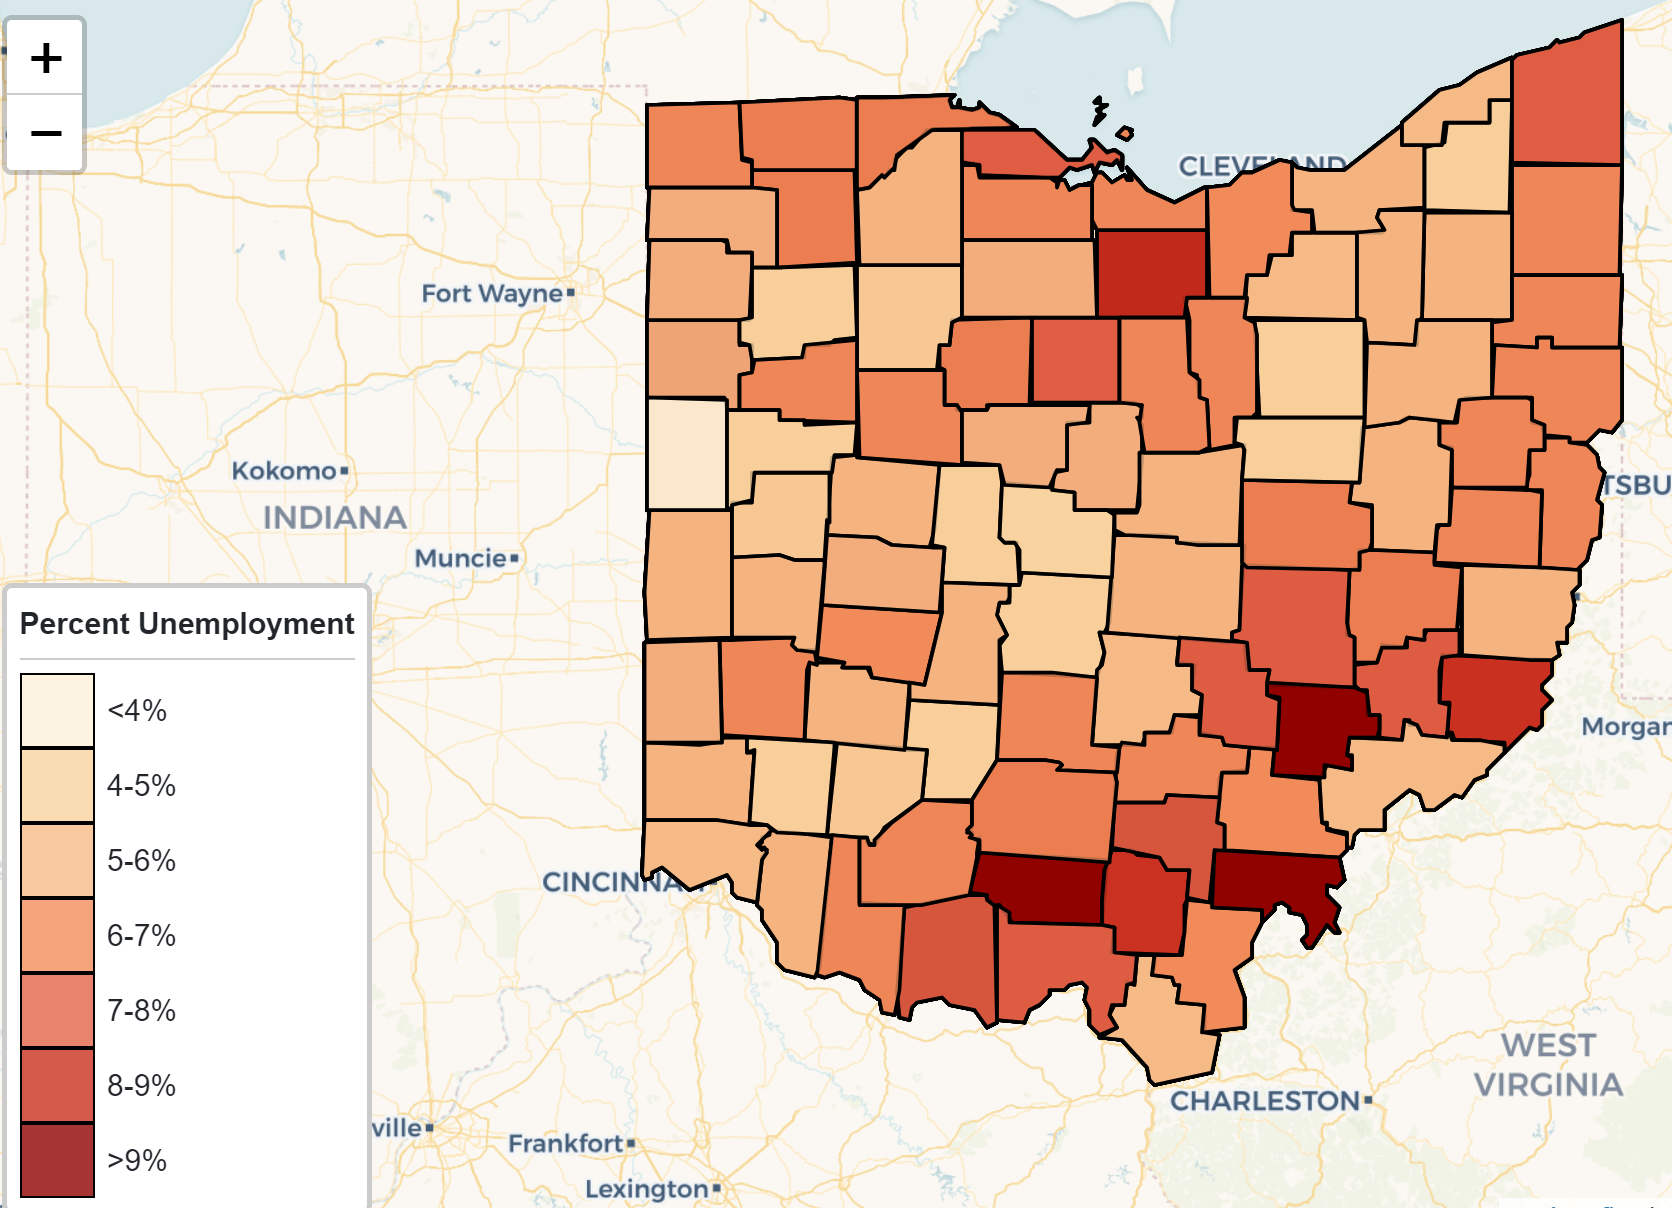
I created this map to show the spatio-temporal distribution of umemployment rates in the state of Ohio between 2000 and 2022. I used economic data from the American Community Survey (with significant data wrangling and reformatting performed in R). County boundary data was obtained from the State of Ohio Department of Transportation.